Insights
Visual & Real-Time Analytics to assist you to make more strategic decisions for growth
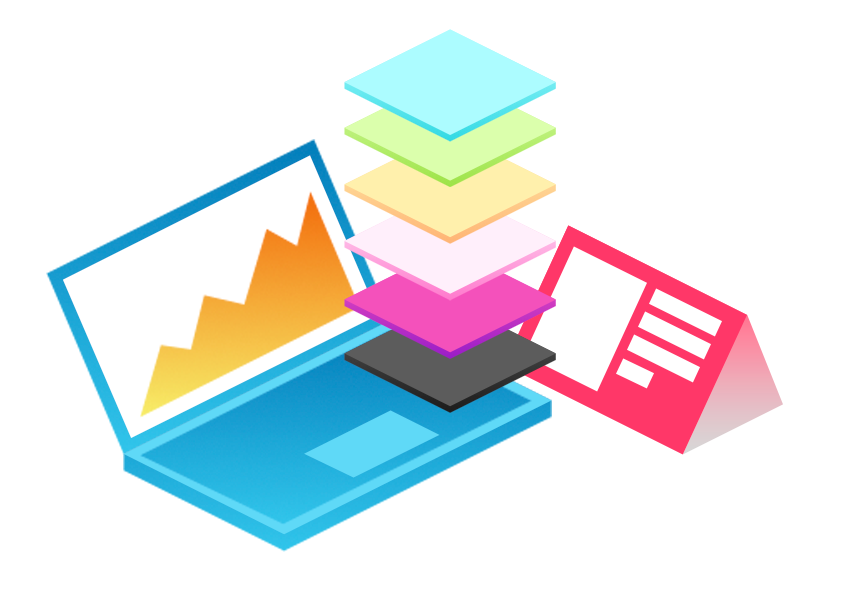
Analytics Dashboard
A plug and play operations dashboard that is ready to give you insights with over 44 different visualisation in the form of bar charts, pie graph’s, key statistic numbers, tracking and comparison. From user behaviour to operational numbers.
Ability to see the time series as well as static data sets which you can filter between day, Month & Year Views.
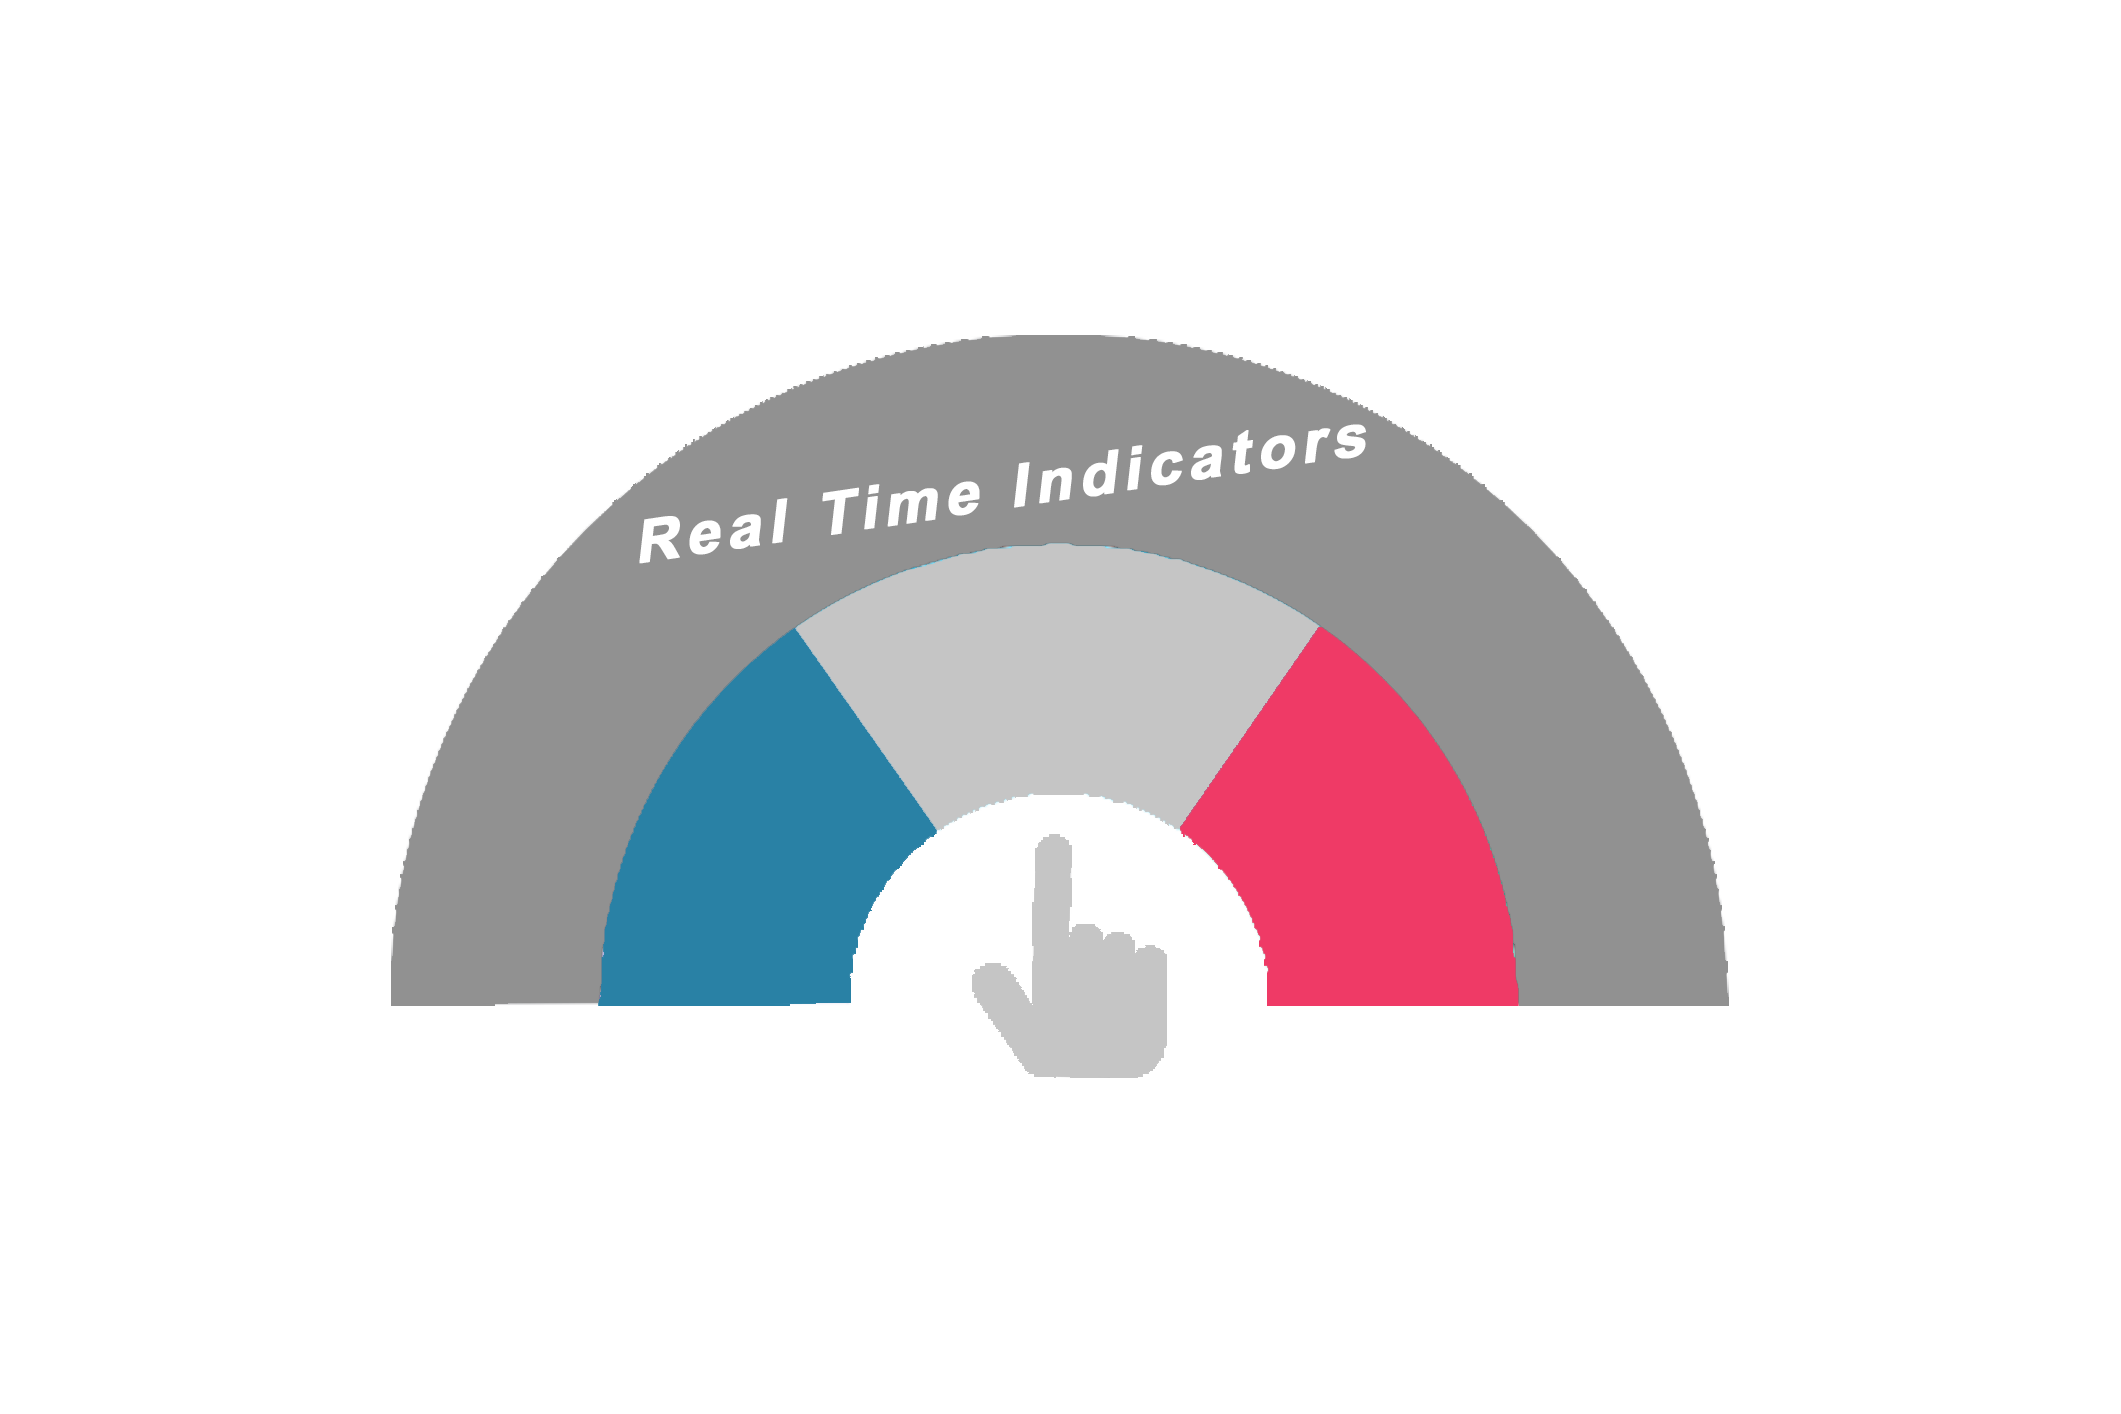
Real-time Insights
As activities happen in your business your Analytics will show in real-time so you can rest assured the numbers you are looking at are always the most up to date and relevant.
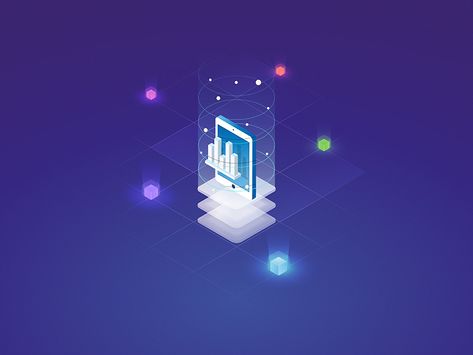
Sensor Monitoring
We know there are number of sensor based companies operating, so we kept our ecosystem open to integrate with sensors or data lakes that you have for time series monitoring, alert status and machine learning actions.
View real-time behaviours of sensors on the management dashboard and action as required.
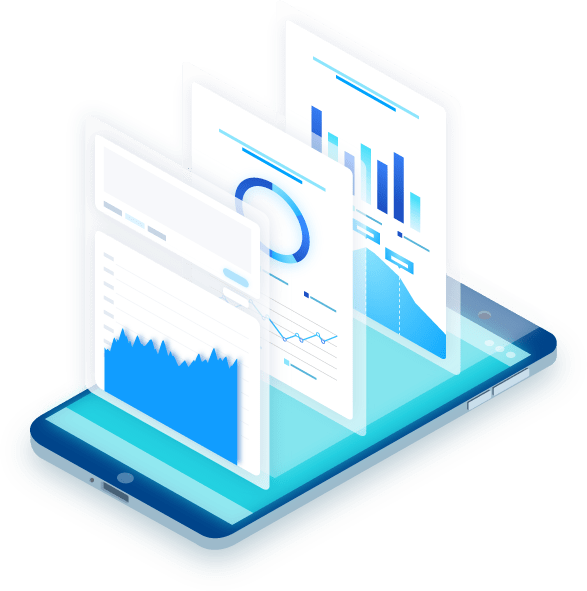
Custom Reporting
PDF and Word reports that can be downloaded and taken to meetings to show status updates. Eliminating time to prepare documents and more time to action.
Book a FREE DEMO ….
Seen enough ? Book a Free DEMO and see what the full Zennexo Suite can offer.
An award winning solution that connects People to Property.
Company
Copyright Stratafy Pty Ltd 2019